Area under a polar function
The familiar xy-plane uses Cartesian coordinates to represent points in a 2D space. Every point in space can be represented by a pair of (x, y) coordinates, representing the distance of the point from the origin in the x and y directions.
There is an alternative coordinate system, polar coordinates. In this system, the position of each point is represented by r (the straight line distance of the point from the origin) and θ (the angle the point makes with the x-axis at the origin). That is shown here:
It is possible to define functions using this coordinate system. For example, here is a spiral function:
It is also possible to find the area under a polar function, and that is what we will cover in this article.
We will look at how to calculate the area under a polar curve using three simple examples - a circle, and spiral, and a cardioid shape. We will also see how to calculate the area enclosed between two curves.
Polar functions
In Cartesian coordinates, it is common to define an equation y = f(x). We can plot the function f(x) by drawing a curve through every point that satisfies the equation.
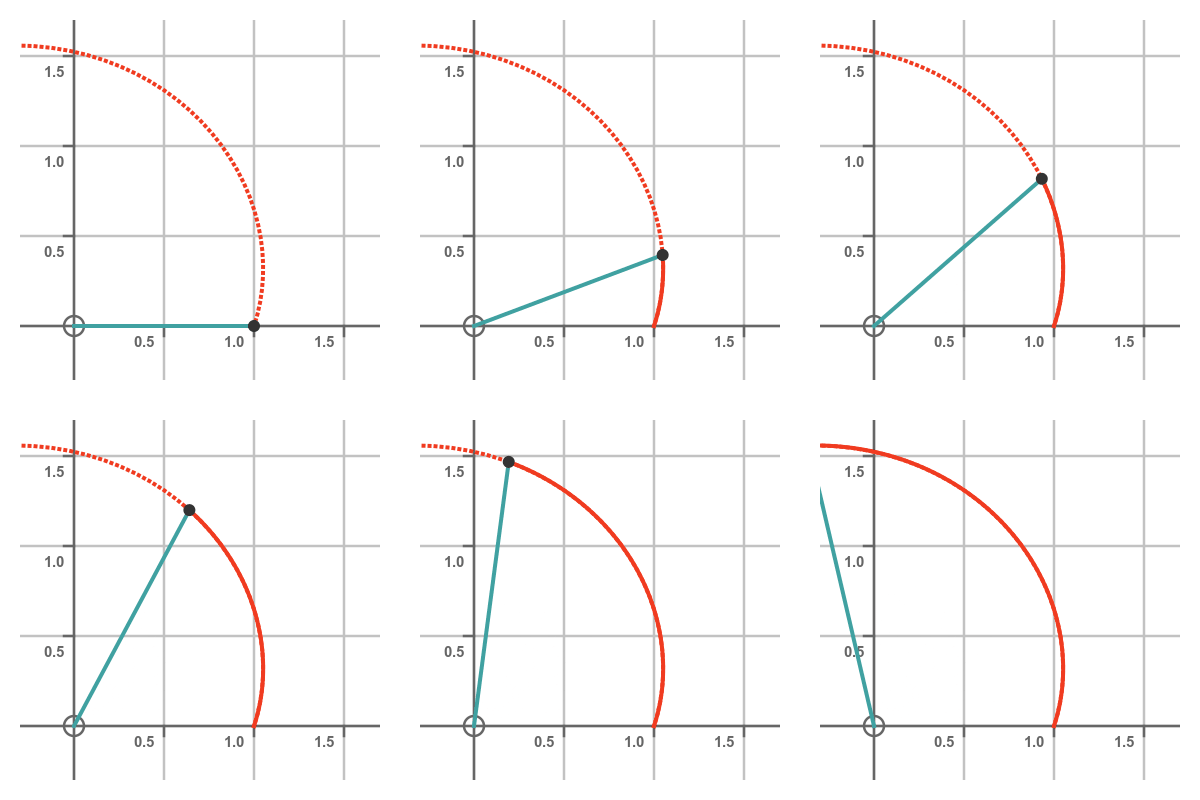
In polar coordinates, we can do a similar thing. We can define r = f(θ). We can plot the polar function f(θ) by allowing θ to vary and calculating the value of r for each value of θ. This animation shows how we can draw a shape this way:
Area under polar curve
We can define the area under a polar curve, between two angles a and b. It is the area enclosed by the curve and the two straight lines from the origin to either end of the curve section, like this:
How can we calculate this area? As you might have guessed, we use integration to calculate this area. However, the calculation is slightly different to the method we use to find the area under a Cartesian curve.
Calculating the integral
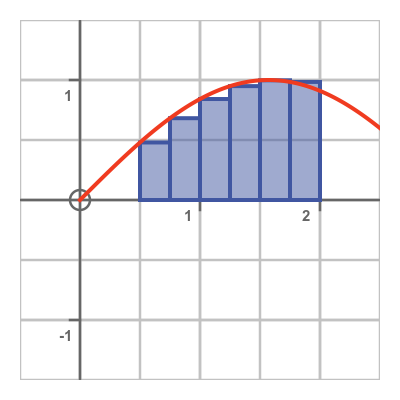
To find the area under a curve in Cartesian coordinates, we often start by dividing the area under the curve into n small rectangles. The height of each rectangle is equal to the value of the function at the left-hand edge of the rectangle, as shown here:
We find the sum of the areas of all the rectangles. This gives an approximation to the area under the curve. If we then double the number of rectangles, while making each rectangle half the width, we will usually end up with a better approximation to the area.
We repeat this process over and over, and each time the number of rectangles doubles, the width of each rectangle halves, and the approximation gets better. As the number of rectangles n tends to infinity (and the widths tend to zero) the sum becomes an integral giving the exact area under the curve.
We can do the same thing with the area under a polar curve r = f(θ), as shown here:
Keep reading with a 7-day free trial
Subscribe to GraphicMaths Newsletter to keep reading this post and get 7 days of free access to the full post archives.


