The Newton fractal (full article)
The Newton Fractal is a fractal based on the Newton-Raphson method for finding the roots of polynomials and other functions. When this method is applied to functions of complex numbers, interesting fractal patterns are created.
This fractal wasn't discovered by Newton, it is named after him because of the Newton-Raphson method.
In this article, we will quickly look at some of the concepts related to the fractal, including the Newton-Raphson method, roots of complex numbers, and differentiation of functions of complex numbers. We won't cover these topics in great detail, just enough to provide context. We will then look at some examples of Newton Fractals.
Here is a video:
Newton-Raphson method
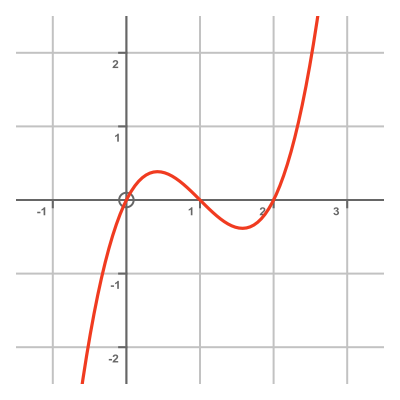
The Newton-Raphson method provides a very efficient way to find the approximate roots of a polynomial. It is illustrated here, where we are trying to find the roots of the polynomial in red:
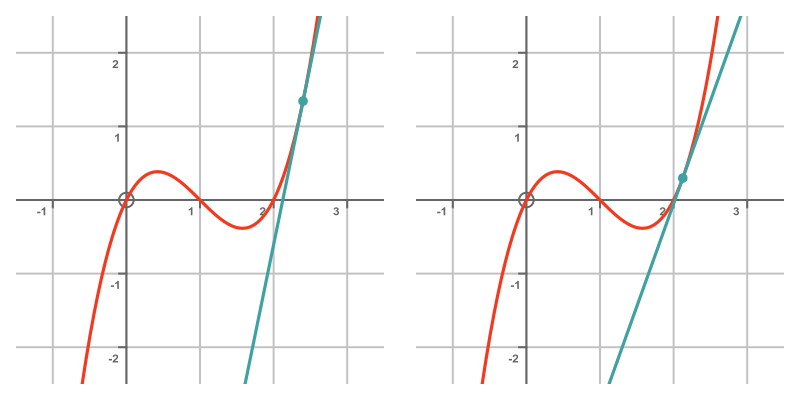
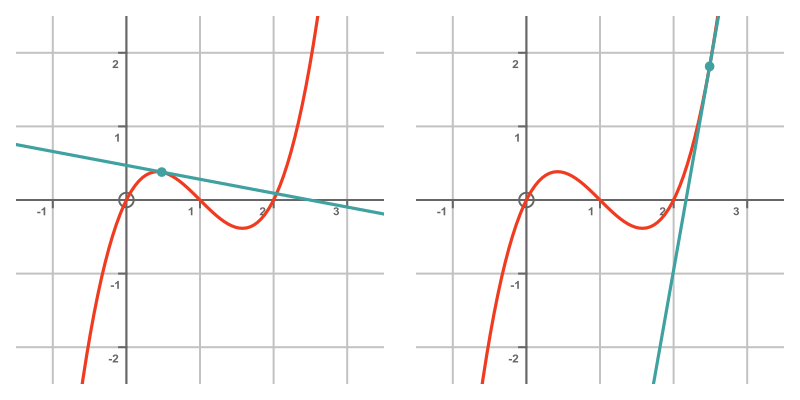
To use the method we must first make an initial estimate of where the root might be. In the left-hand graph below, we have picked an initial guess of x = 2.4 and marked the point in the graph where x is 2.4.
Then we draw a tangent to the curve at that point and find out where that tangent crosses the x-axis. From the graph below (on the left) we can see that the tangent hits the x-axis at approximately 2.1:
Now replace our original estimate, 2.4, with the new estimate 2.1, and repeat the procedure. This is shown in the graph above on the right. This time the new tangent hits the x-axis at a point that is even closer to the root. Repeating this a few more times will often lead to a result that is very close to the real root.
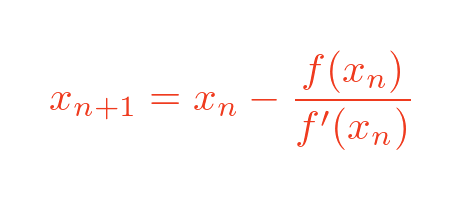
We have drawn the tangents for illustration, but in fact we can calculate the result without drawing anything. If x(n) is our current guess, we can calculate the next guess, x(n+1) from the following equation:
Here f(x) is the function we are trying to find the roots for, and f'(x) is the first derivative of that function. This formula is derived in the Newton-Raphson method article.
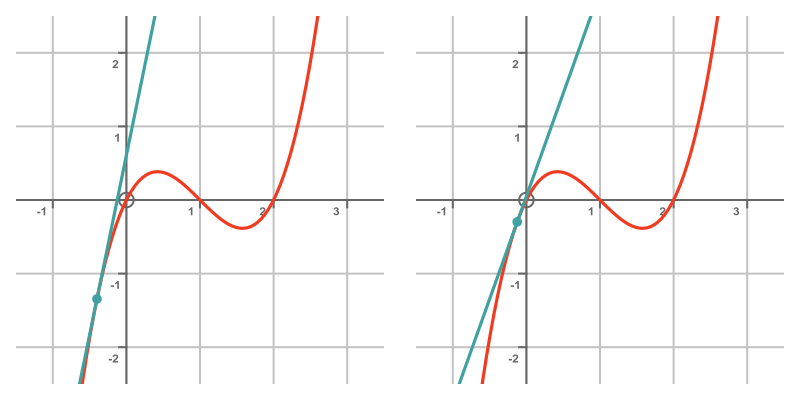
As we can see from the graph, the function crosses the x-axis in three places. Depending on our initial guess, the formula might converge on a different solution. For example in this case we start with an x value of 0.4 and the method converges on the root at 0:
Unexpected behaviour
The Newton-Raphson method will often converge on the closest root, but that isn't always the case. Here is an example:
We start with an initial estimate of 0.48. But at that point on the graph, the slope is quite shallow, so the tangent hits the x-axis quite a long way from the initial position, where x is about 2.5. If we continue the process it will actually converge on the root at x = 2, even though our start position was much closer to the root at x = 0.
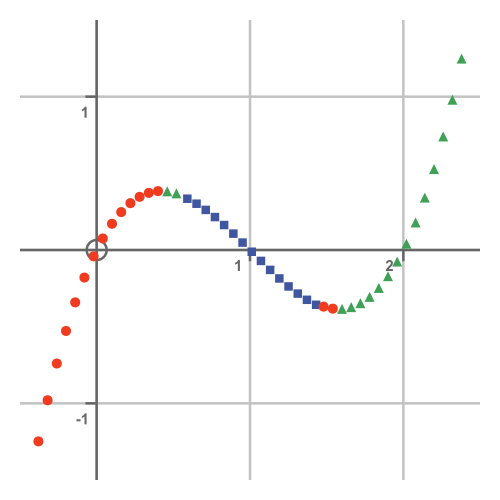
Here is a graph that shows which solution we will get for each starting position:
Starting positions marked with a red dot will converge on 0, those with a blue square will converge on 1, and those with a green triangle will converge on 2.
This shows that the method will usually converge on the closest root. But there are a couple of areas where this will not happen. The small region of green triangles at around x = 0.5 will converge on 2, and the small region of red dots at around x = 1.5 will converge on 0.
Complex roots of polynomials
As we will see shortly, applying this method to polynomials involving complex numbers shows a similar effect to the one above. Certain starting points don't converge on the closest root. But the patterns are far more interesting.
But first, we need to look at complex roots of polynomials. We will take a very simple example, x cubed. This equation:
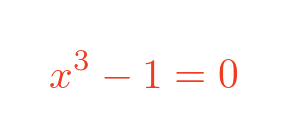
Has a solution where x is the cube root of 1. If x is a real number, there is only one solution, which is x = 1.
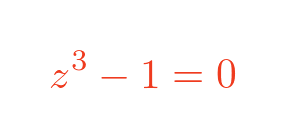
But what about the same equation using a complex variable, z?
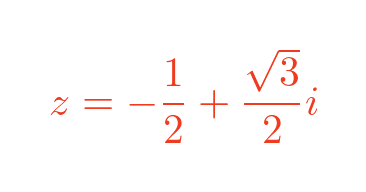
This equation still has a solution z = 1. But it has a couple of complex solutions too:
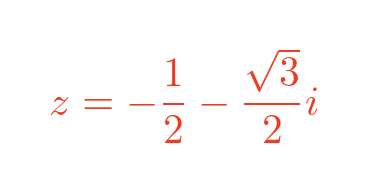
and:
It is easy to check this, simply calculate z times z times z for either of these numbers and the result will be 1.
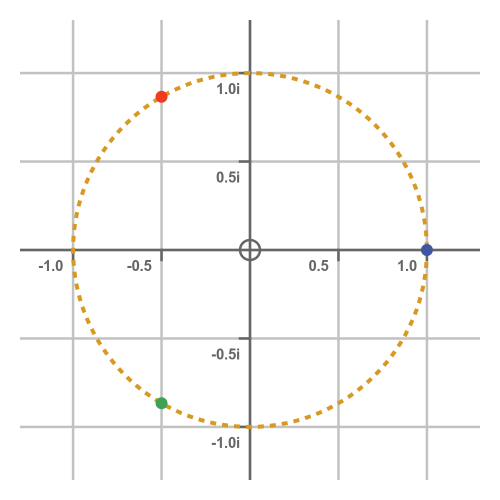
If we plot these points on an Argand diagram we see this:
The three roots are equally spaced around the unit circle on an Argand diagram.
Newton-Raphson for complex functions
The Newton fractal appears when we apply the Newton-Raphson method to find the roots of a complex polynomial such as z cubed minus 1.
But how do we apply this method to a complex polynomial? We need to be able to differentiate z cubed. Is that even possible?
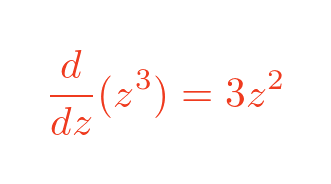
Well, actually it is possible to differentiate certain complex functions, including complex polynomials. We won't prove it here, it is a large topic in its own right, but differentiating a complex polynomial works in exactly the same way as differentiating a real polynomial. So for z cubed:
We can apply the original Newton-Raphson formula to the complex function z cubed, like this:
This doesn't work for all mathematical functions, but it works for polynomials and quite a few other functions such as sine and cosine.
The Newton fractal of z cubed
If we take any particular point z in the complex plane, we can apply the Newton-Raphson formula, and find out which root it converges on.
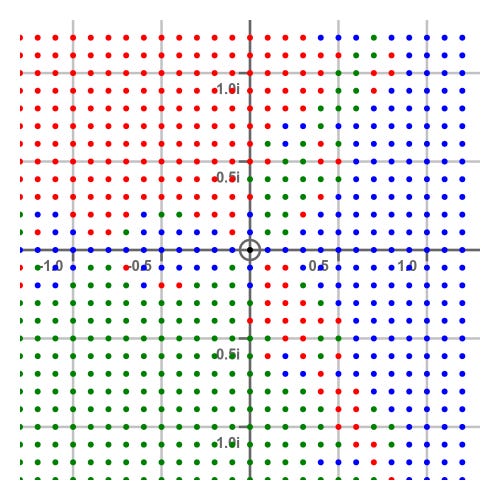
In this image, this calculation has been performed for different points in the complex plane. Each point is marked with a red, green or blue dot to indicate where it converges:
Compare this with the three cube roots of 1 shown on the Argand diagram above, also coloured according to the same scheme. Clearly, most of the points are the same colour as the nearest root, meaning that most points converge on their nearest root. But it is also clear that some points converge on a different root.
Notice also that there is one solitary black dot, at the origin where z is zero. At point zero the first derivative is zero, so the next iteration of the sequence cannot be calculated. That point doesn't converge on any root. This makes sense when you think about it - point zero is an equal distance from all three roots, so how could it converge on any one of the roots?
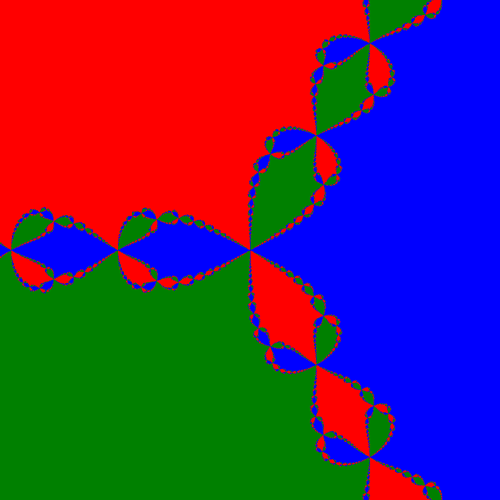
The next step is to calculate the root of convergence at lots more points. To create an image, we can calculate the root for every single pixel in the image, and colour each pixel accordingly. Here is the result:
This is the Newton Fractal for z cubed. The structure is fractal in nature. There are three main areas, in red, green and blue. But the boundary between those shapes is broken by a string of large teardrop shapes of contrasting colours. The shapes along the boundary between the red and green area are blue, and the other boundaries also contain contrasting colours.
Each of the large teardrops is bounded by smaller teardrops. Each of those smaller teardrops is bounded by even smaller teardrops. That continues forever - you can zoom in as far as you like there will always be more detail. And the shapes are always similar, but not identical.
Shading
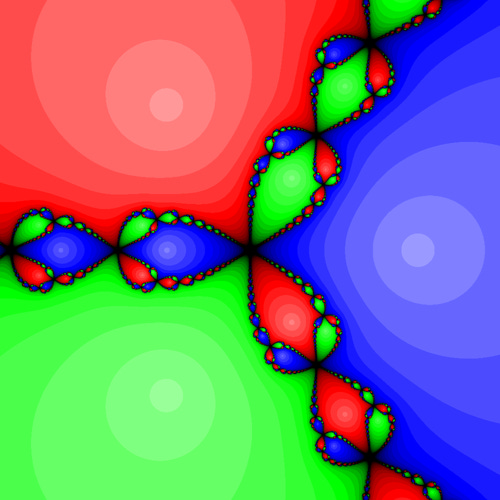
In this image, we have added an extra detail. For each pixel, we don't only check which root it converges on, we also check how long it takes to converge:
Specifically, we check how many iterations it takes for the formula to get to within 0.01 of the root. The colour is made lighter for points that converge quickly, and darker for points that take longer to converge. This tells us that points that are in the middle of a shape converge more quickly, but points that are close to the boundary of two different colours converge more slowly.
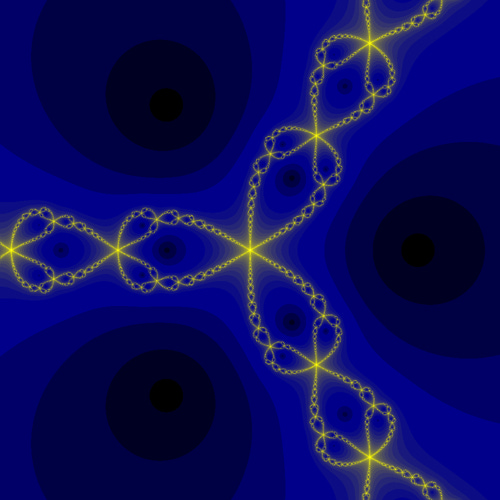
Here is a different shading scheme:
This time the colour only depends on the convergence time. It doesn't matter which root the point converges on. So the three main segments of the fractal are identical.
We have used dark colours to show points that converge quickly, and bright colours to show points that converge slowly.
This highlights the intricate shapes of the boundaries between the areas.
Fourth root
Here is a Newton Fractal formed using the fourth root rather than the cube root. The fourth root of 1 has four solutions: 1, -1, i and -i.
It is also possible to create fractals based on other polynomials, containing multiple terms.


